05 — Implementation
Implementation
Hardware build, firmware architecture, UART communication protocol, Grafana dashboard features, and software documentation for the R.E.A.C.H. system.
Overview
System Overview
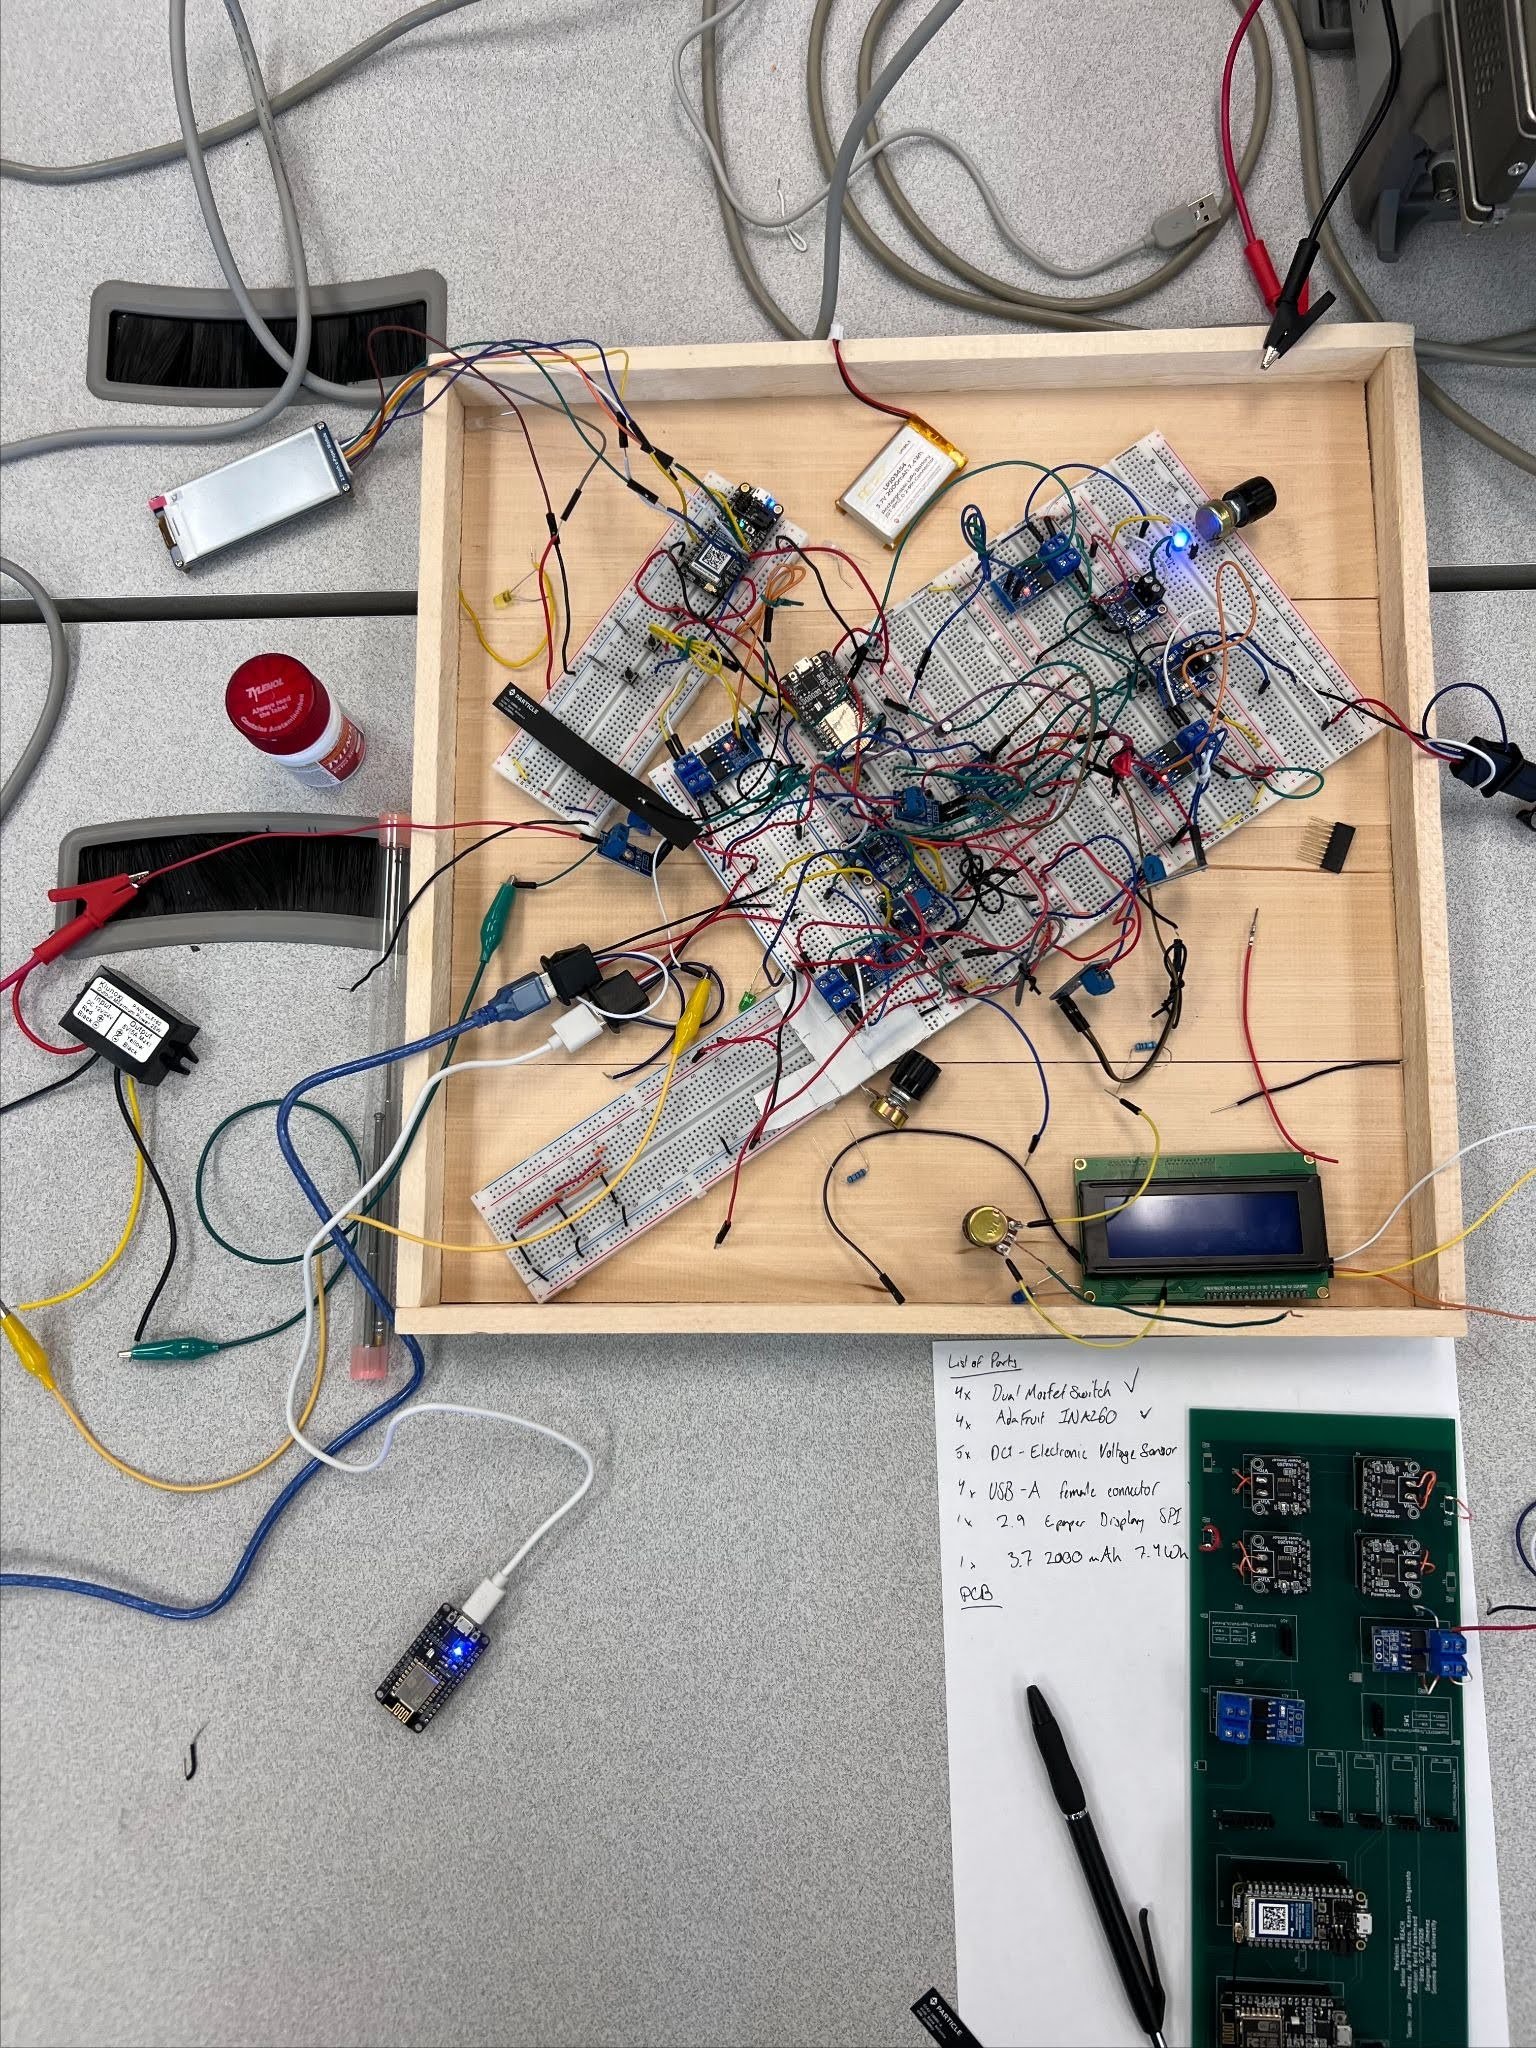
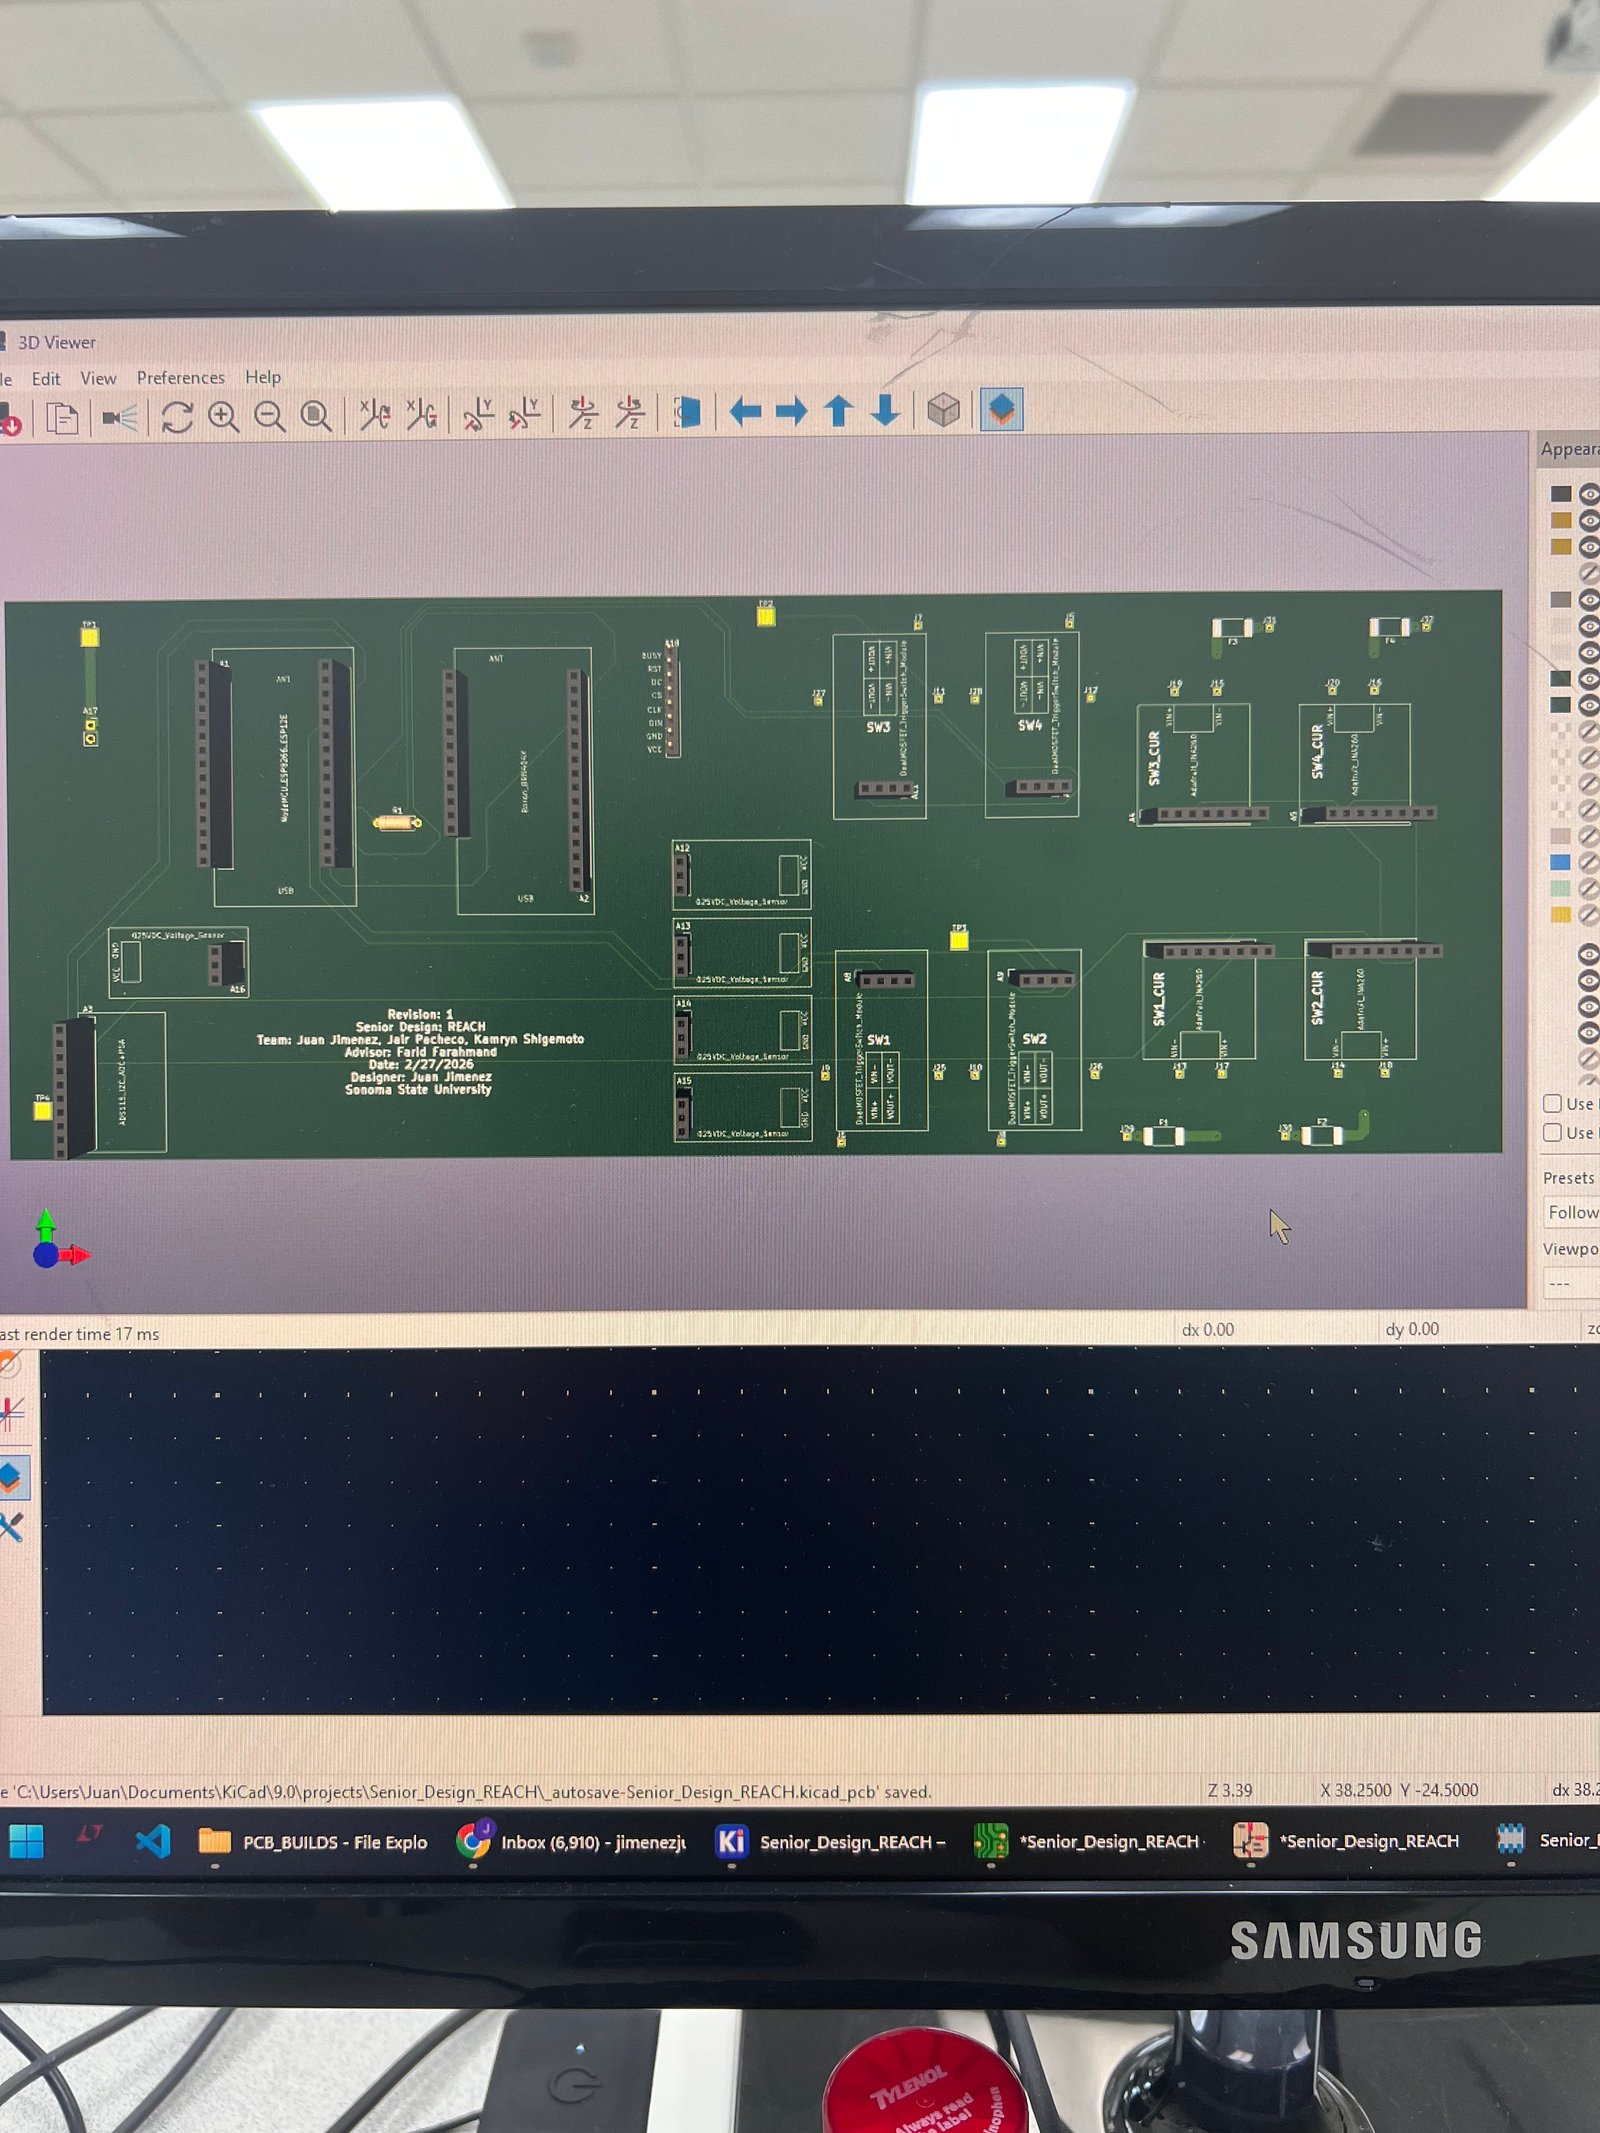
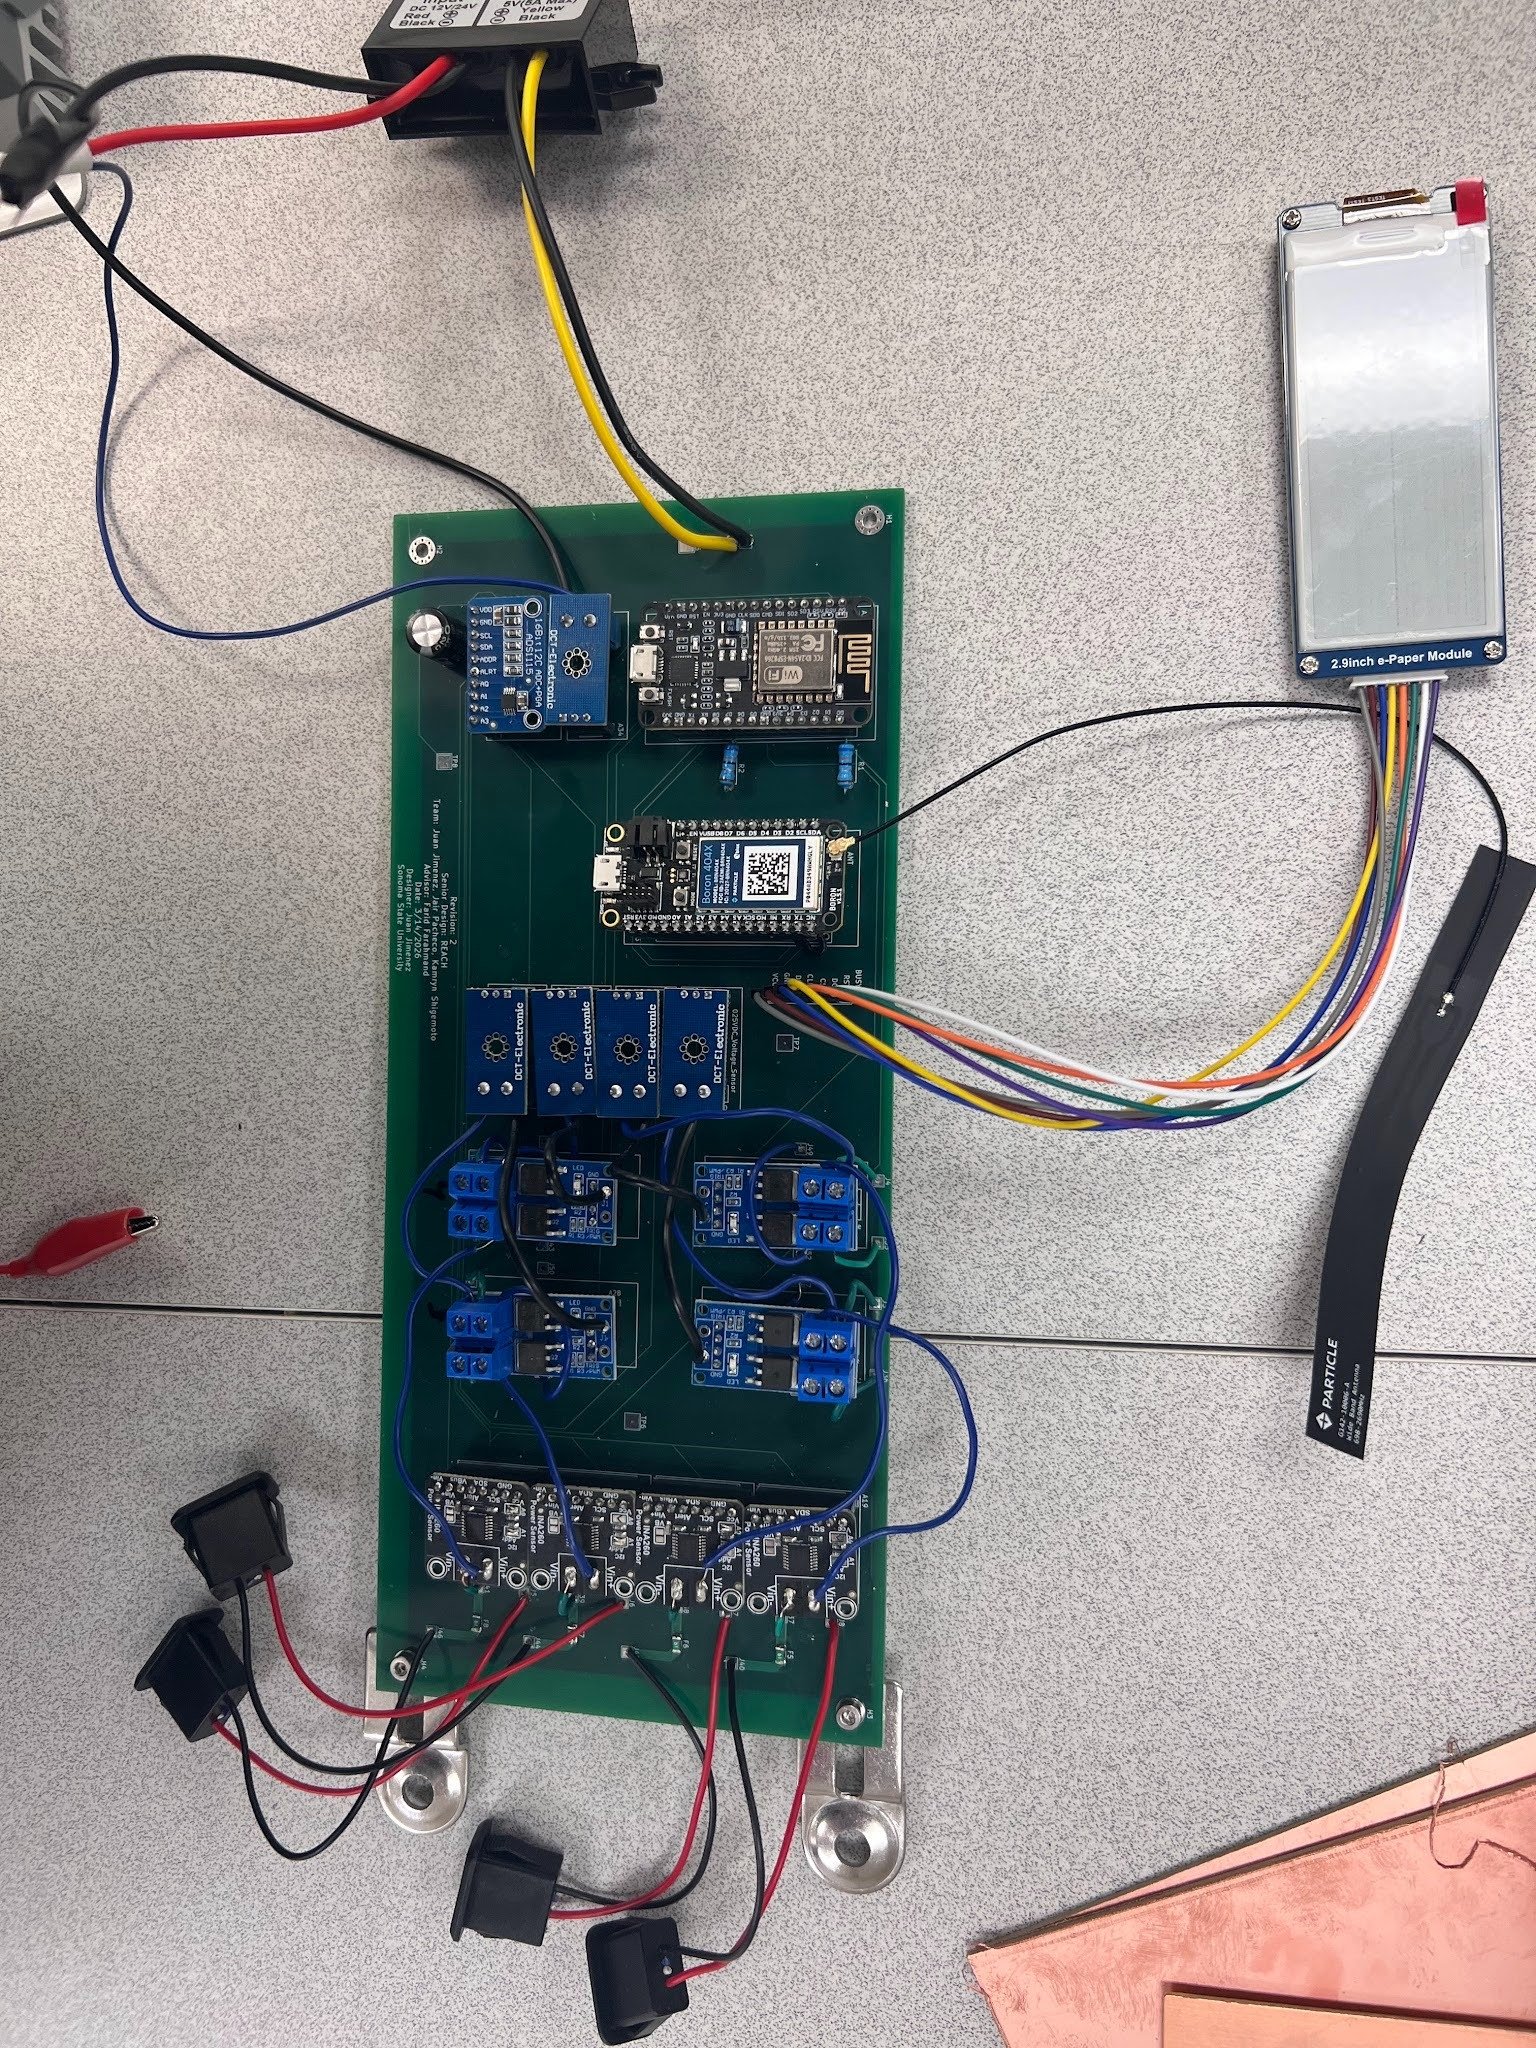
R.E.A.C.H. is built around two main components: the main control hub and the remote Grafana cloud dashboard. The main control hub contains the ESP8266, Particle Boron 404x, INA260 current sensors, DCT voltage sensors, ADS1115 ADC multiplexer, Dual MOSFET switches, a 12V–5V buck converter, and a Waveshare E-Ink display. The dashboard handles remote monitoring, outlet control, scheduling, load prioritization, and telemetry data analysis.
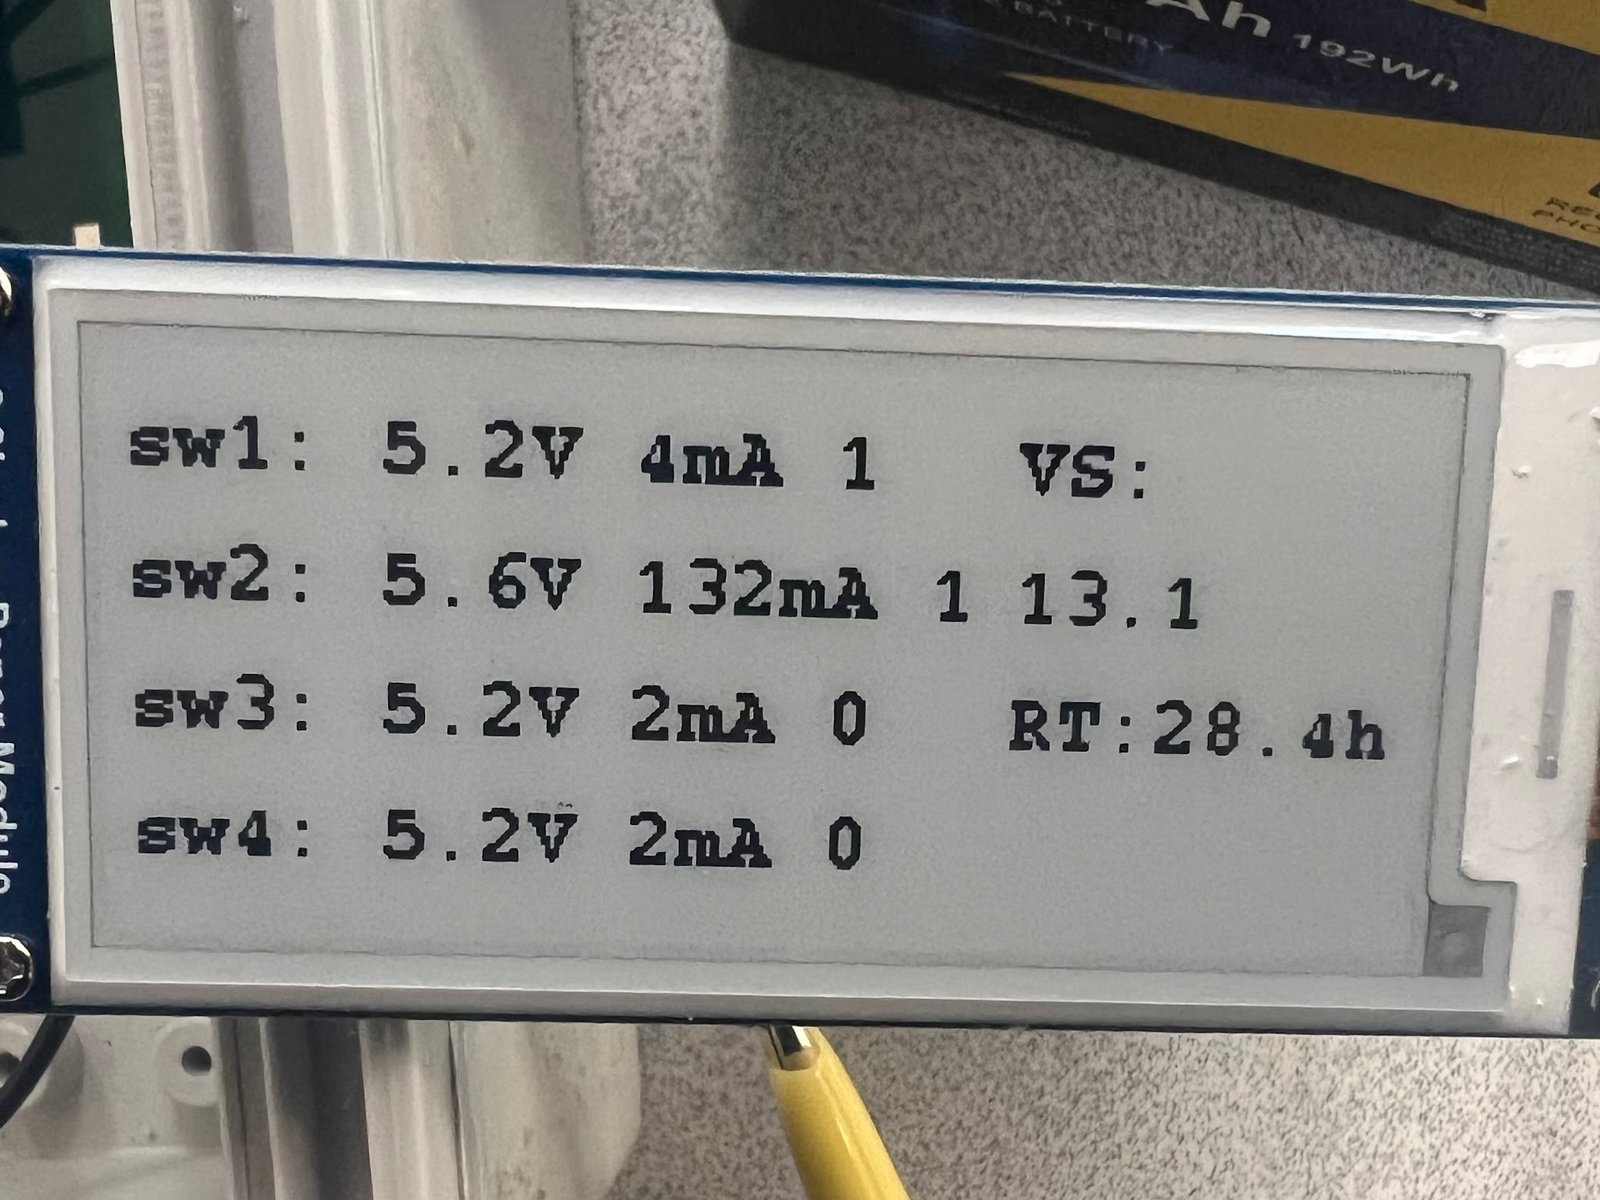
Fig. 14 — E-Ink Display showing system and switch information
Hardware
Hardware Components
01
Particle Boron 404x — LTE Gateway
The Boron is the communications brain of R.E.A.C.H. It uses a wideband LTE-CAT M1 antenna to connect to the cloud even without WiFi. It has an onboard RTC that auto-syncs on boot, enabling accurate UTC-based scheduling. It connects to a single-cell LiPo 3.7V battery for backup power and communicates with the ESP8266 via UART.
02
ESP8266 12-E NodeMCU — Local Control Engine
The ESP8266 controls all four USB outlets and reads sensor data. It manages the I²C bus to poll INA260 current sensors and the ADS1115 for analog voltage readings. It controls each Dual MOSFET Switch module via GPIO, executes schedules, applies priority rules, and packages telemetry for the Boron via UART.
03
Adafruit INA260 — Current Sensing
Four INA260 modules measure current in series with each USB outlet. They use an internal shunt resistor measured at 16-bit resolution, allowing measurements as small as 1.5 mA. They communicate over the I²C bus and provided pass-level accuracy of ±10 mA in testing.
04
DCT-Electronic Voltage Sensors + ADS1115
Five DCT voltage sensors use a voltage divider to scale high voltages to safe analog levels. Because the ESP8266 only has one ADC, the ADS1115 16-bit ADC multiplexer is used to read multiple analog inputs over I²C. Voltage measurements passed at ±0.2V accuracy after calibration.
05
Waveshare E-Ink Display
The E-Ink display is the local UI for R.E.A.C.H. It consumes very little power, has no backlight, and shows outlet status (voltage, current, state), supply voltage (VS), and schedule acknowledgment (ACK). It refreshes on new data with a minimum 5-second interval to protect the panel and conserve power.
06
Klunoxj Buck Converter + Circuit Protection
The buck converter steps 12V battery voltage down to 5V for the system. It is rated for 5A/25W with output surge protection. Four manually resettable fuses (≤ 1A each) protect the USB output lines. All components are housed in a waterproof IP65 enclosure for outdoor field use.
Local Access
Local Webpage
The ESP8266 hosts a local PHP webpage over its built-in WiFi hotspot, allowing direct outlet control without internet access. Users connect their device to the ESP's WiFi network and open the local URL to toggle outlets on or off.
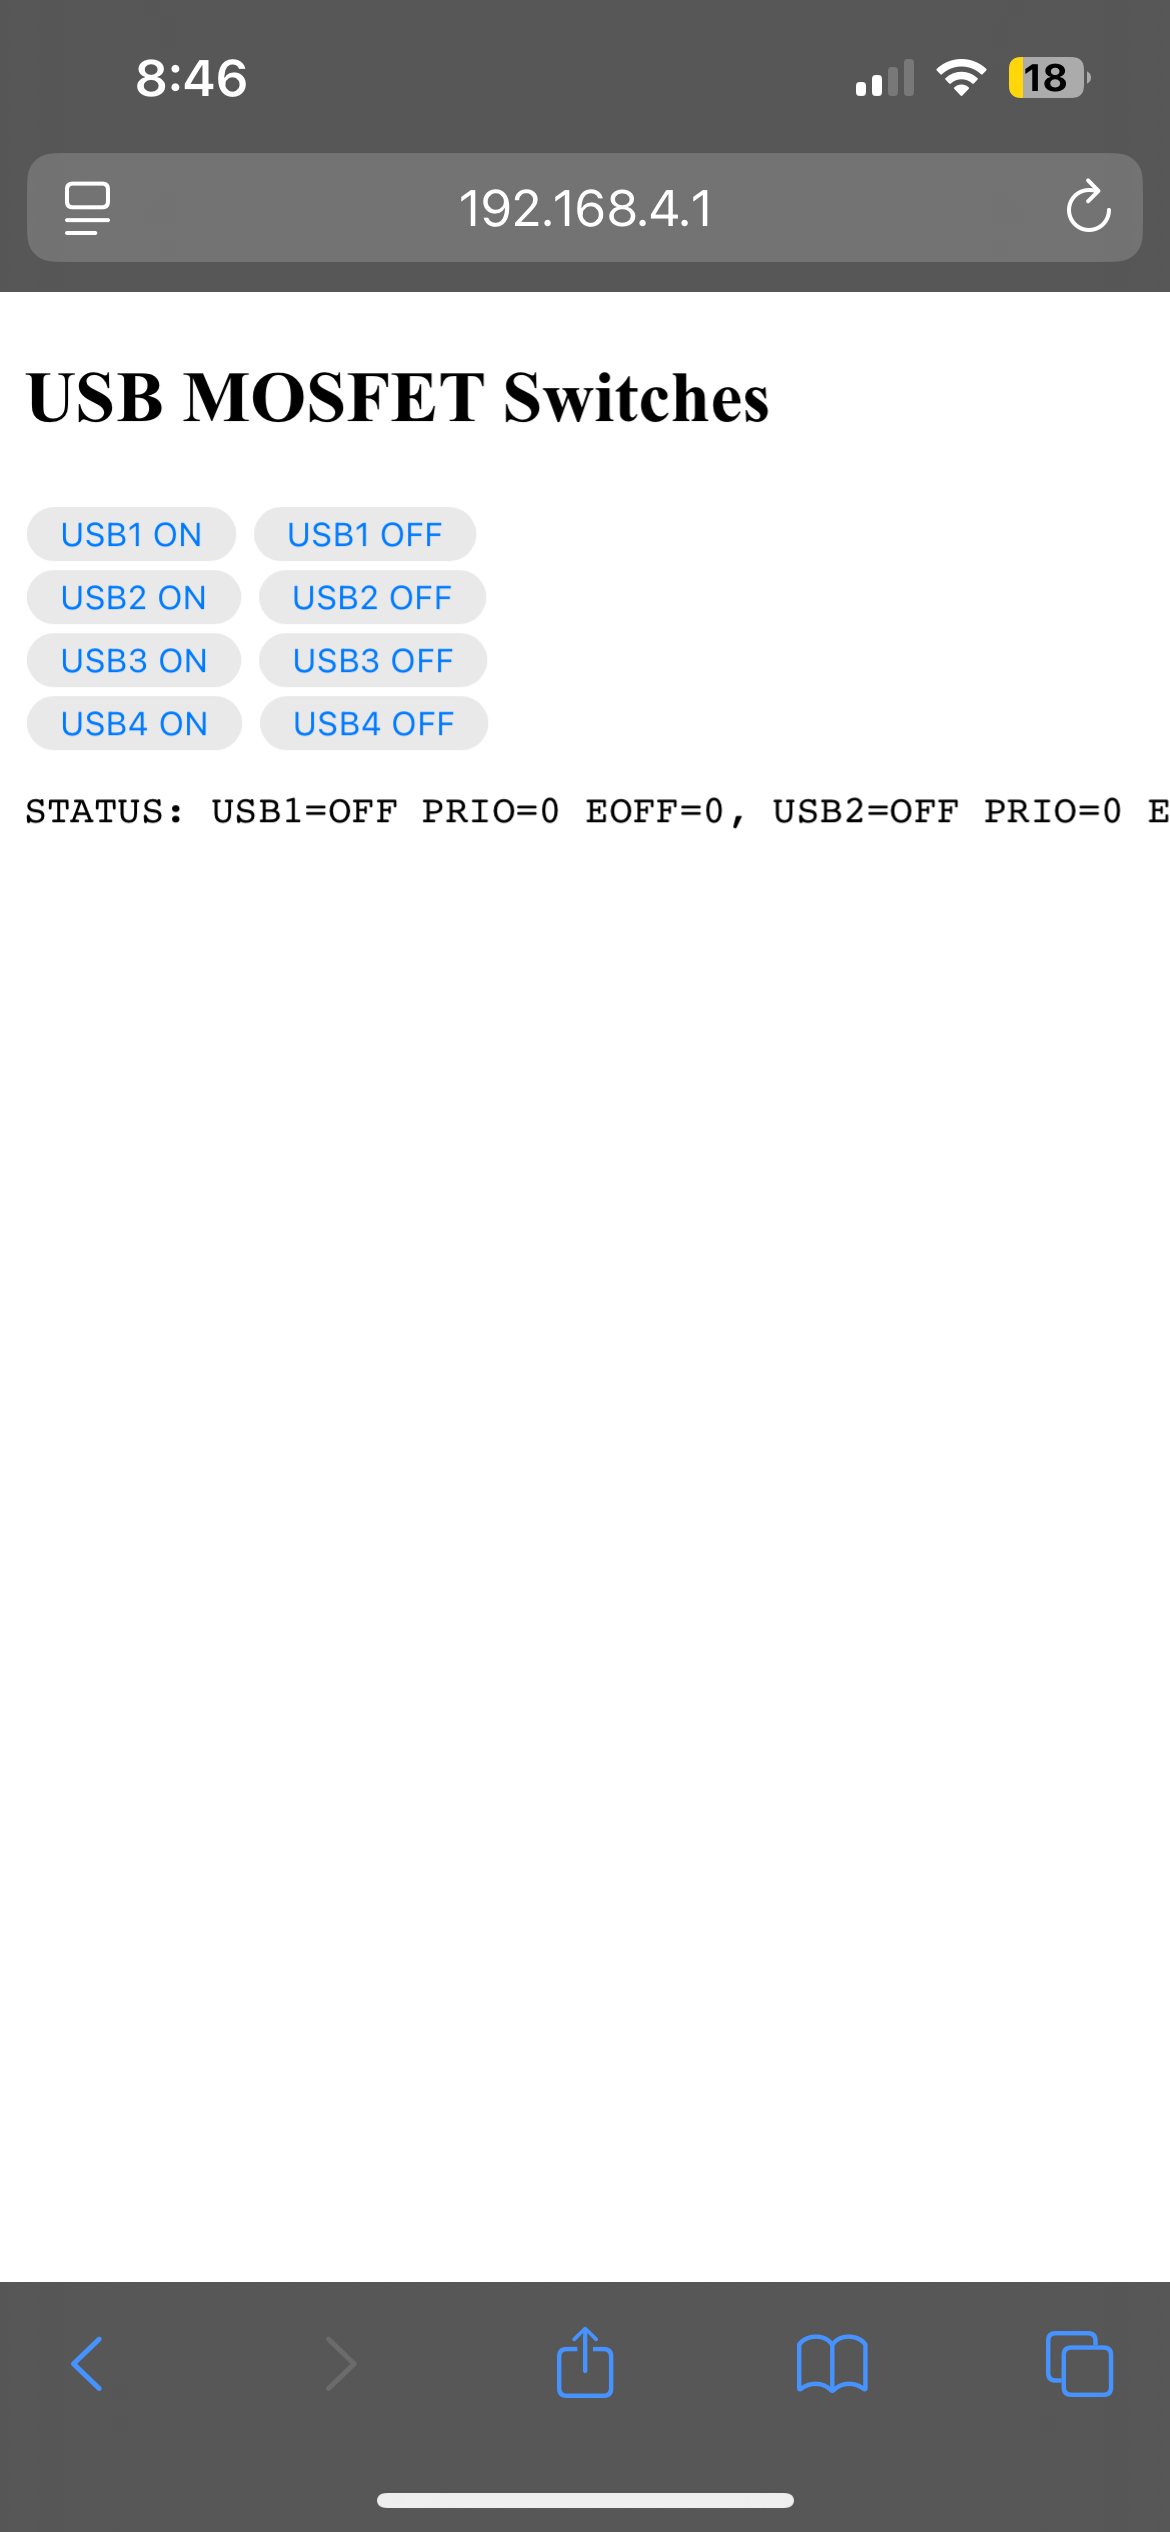
Fig. 19 — Local Webpage for Outlet Control
Software — Communication
UART Communication Layer
The Boron and ESP8266 communicate via a simple UART serial link — the internal backbone of the system. UART was chosen for its simplicity, low power use, native support on both microcontrollers, and ease of debugging via serial monitor.
Boron → ESP Commands
TIME=<epoch> // Time sync every 1 second
SCHED,<outlet>,<start>,<end>,<target>,<enabled> // Schedule update
USB1=ON / USB3=OFF // Manual outlet commands
PRIORITY,2,LOW / PRIORITY,4,HIGH // Priority assignment
PRIO=1010 // Compact bitmap for all outlets
ESP → Boron Telemetry (Per Outlet)
USB1,STATE=1,PRIO=1,EOFF=0,SCHED_EN=1,
SCHED_START=1700000000,SCHED_END=1700003600,
SCHED_TARGET=1,OVERRIDE=0,OVERRIDE_TARGET=0,
OVERRIDE_UNTIL=0,CURRENT=0.123,VOLTAGE=5.01,
SUPPLY=12.30,EPOCH=1736238123,RUNTIME=50.4
Software — Timing
System Timing Intervals
The Boron uses non-blocking timers based on millis() so all tasks run in parallel without freezing the system.
| Task | Interval | Purpose |
|---|
| Time Sync to ESP | Every 1 second | Sends current epoch so ESP can execute schedules accurately |
| Schedule Polling | Every 60 seconds | Checks cloud for updated user-defined schedules |
| Command Polling | Every 30 seconds | Checks for manual ON/OFF button presses from dashboard |
| Priority Polling | Every 45 seconds | Staggered from other tasks to reduce network congestion |
| Telemetry Upload | Every 10 minutes | Sends sensor data to cloud — slower to save bandwidth & power |
| E-Ink Refresh | Min. 5 second spacing | Updates display only on new data; protects panel lifespan |
Software — Dashboard
Grafana Dashboard Features
The Grafana cloud dashboard is the primary remote interface for R.E.A.C.H. It connects to the database via the Particle Boron's LTE connection and provides monitoring, control, scheduling, and load prioritization.
Data Flow
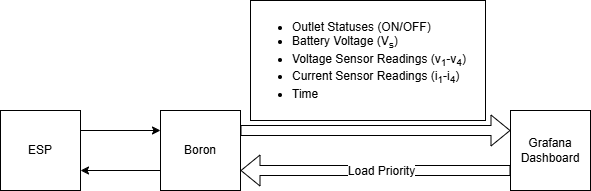
Fig. 7 — Data Flow to the Grafana Dashboard
Dashboard Overview
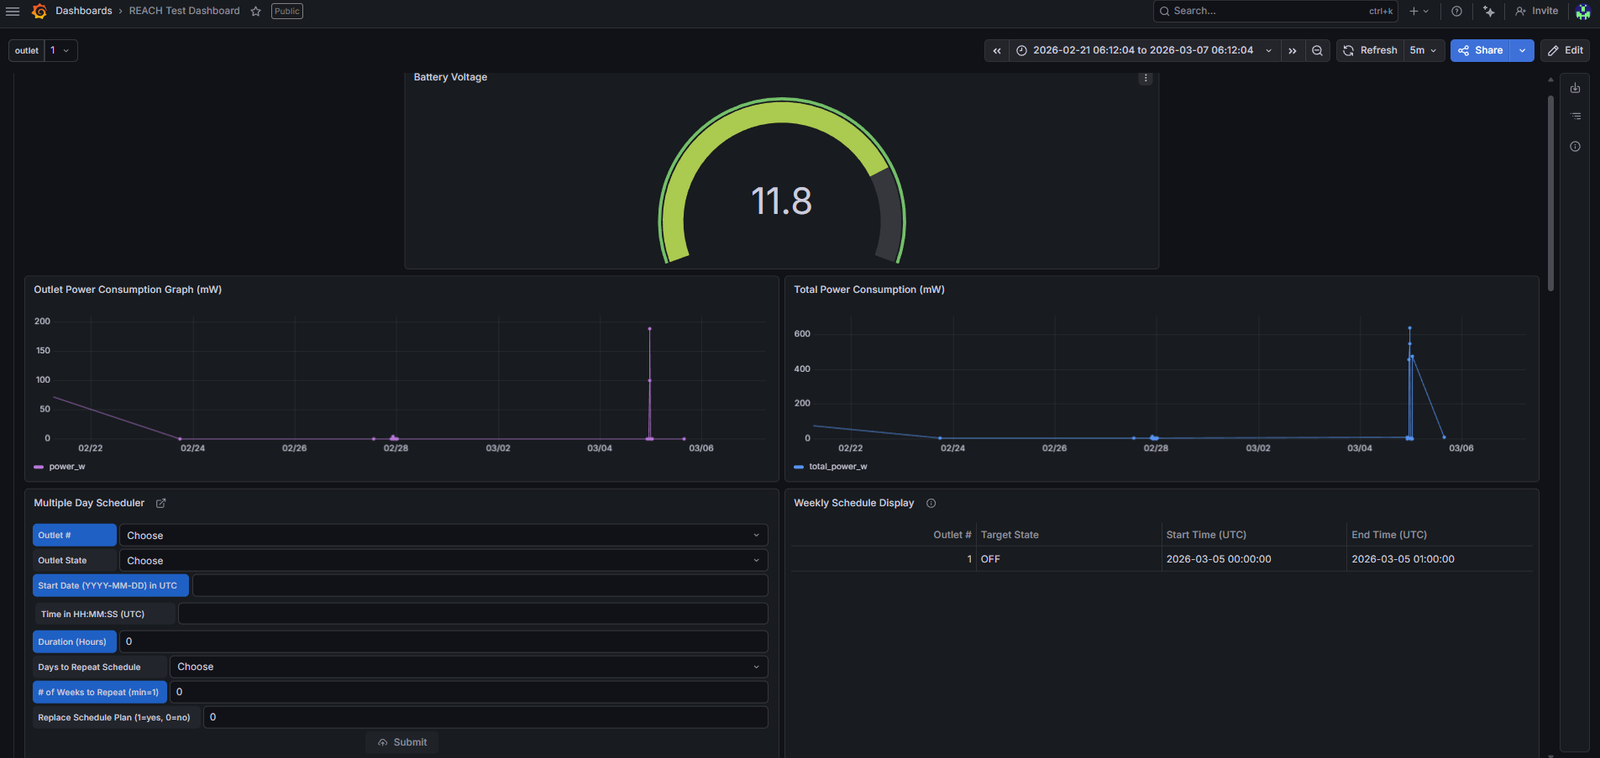
Fig. 8 — Visual Explanation of Dashboard Features
Manual Outlet Control
Users can toggle each outlet on or off manually from the dashboard. Stat panels show the live status of all four outlets.
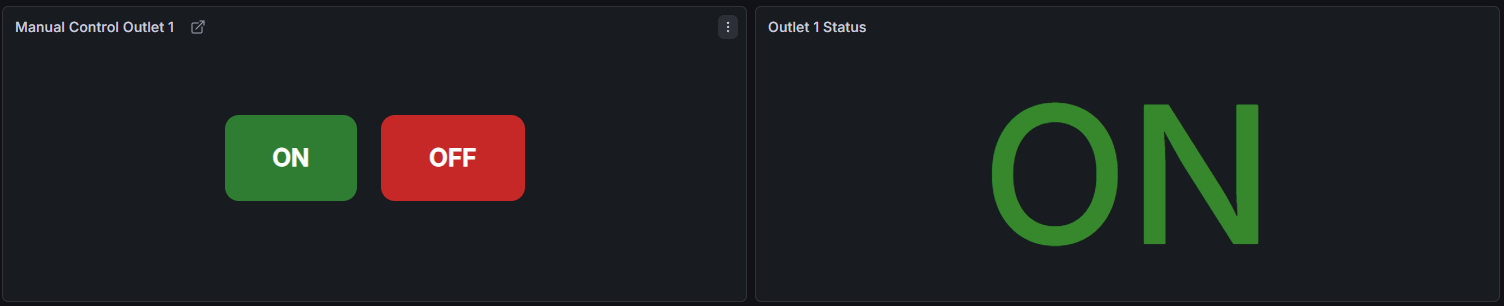
Fig. 10 — Manual Control Buttons and Stat Panels with Outlet Status
Scheduling
Users can schedule individual outlets to turn on or off at specific times. Schedules are stored in the database and polled by the Boron every 60 seconds.
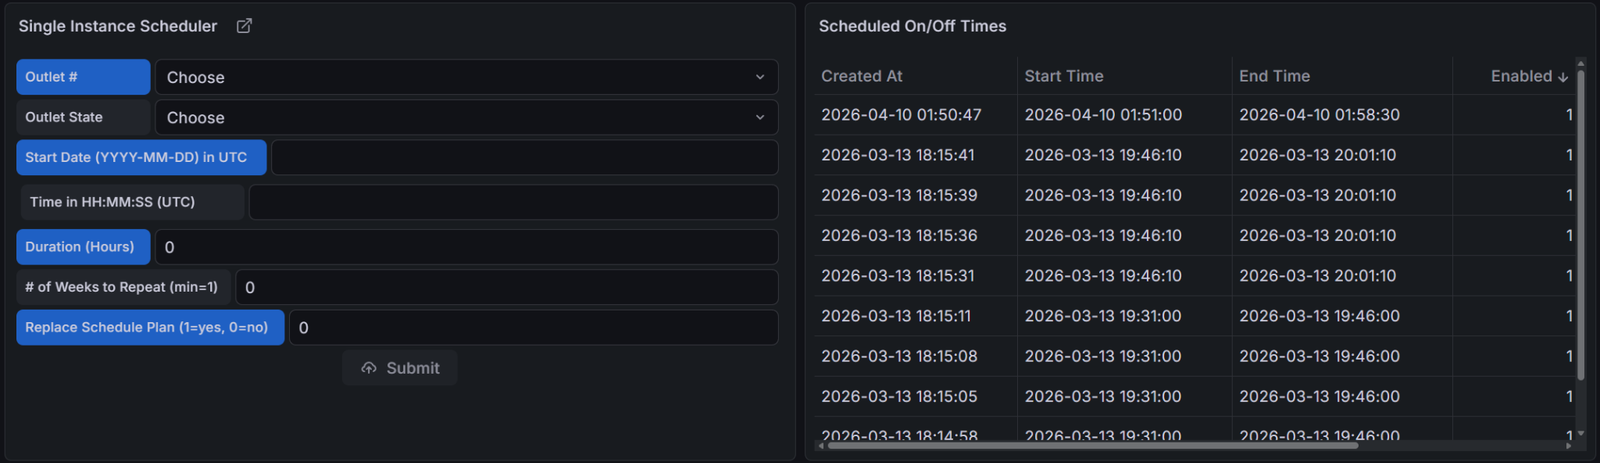
Fig. 11 — Scheduling Panel and Weekly Schedule Display

Fig. 15 — Software Flowchart for Scheduling
Load Prioritization
When battery voltage drops below 11.8V, load prioritization activates. High-priority outlets remain on; low-priority outlets are shut off — highest-current drawing load first. When voltage recovers, low-priority outlets automatically restore.
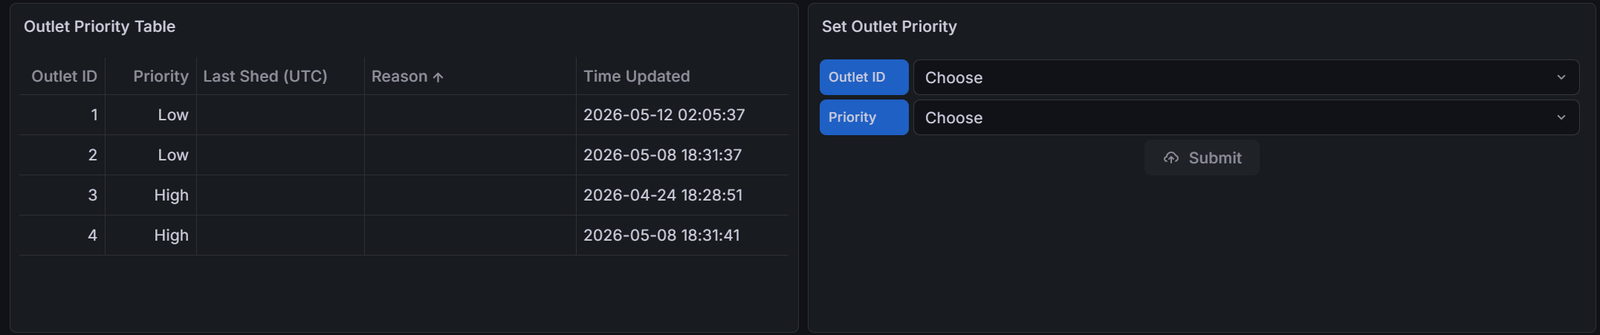
Fig. 12 — Load Prioritization Panels

Fig. 13 — Load Prioritization Alert Flow Diagram
Build Photos
Assembly & Build Photos