02 — Methodology
Methodology
An outline of the research approach, literature review, design methodology, communication strategy,
and testing process used throughout the development of R.E.A.C.H.
Overview
Approach & Process
Development began with researching existing solutions and evaluating how they could be improved while
comparing their functionality with what R.E.A.C.H. plans to provide. Constant communication was maintained
with industry advisors, academic advisors, and the client at Husch Vineyards to keep all parties informed
and incorporate feedback throughout the process.
A significant amount of time was invested in creating accurate hardware and software diagrams, kept updated
with every design change. A series of tests were planned and conducted to ensure components meet senior design
standards and engineering requirements are satisfied. The workload was laid out in a detailed schedule with
division of labor between group members to maximize productivity and accountability.
Process
Step-by-Step Methodology
01
Literature Review & Research
Reviewed existing commercial solutions (OutBack OpticsRE, Victron VRM, Morningstar) and academic IoT
monitoring systems to identify gaps. Found that most solutions address only monitoring or only control —
not both. REACH was designed to combine LTE communication, outlet-level control, scheduling, and load
prioritization into one portable add-on system.
02
Advisor & Client Communication
Maintained ongoing communication with Dr. Farahmand (faculty), Mr. Mervine (industry advisor), and
Mr. Robinson (client, Husch Vineyards) to shape research direction, testing plans, and construction
decisions.
03
Hardware & Software Diagram Development
Created detailed block diagrams for the main control hub, sensor and switches block, E-Ink display
architecture, and full system data flow. Diagrams were kept updated with all design changes including
the switch from INA219 to INA260 sensors and the addition of ADS1115 for analog voltage reading.
04
Component Selection via Design Matrices
Used weighted design matrices to select the main microcontroller (ESP8266), LTE transceiver (Particle
Boron 404x), and switching components (Dual MOSFET Switch modules). Cost and power consumption were
heavily weighted criteria given the battery-powered, remote deployment context.
05
Function & System Testing
Conducted 11 function tests and 2 system tests across Fall 2025 and Spring 2026 covering two-way
communication, WiFi control, sensor accuracy, scheduling reliability, link reliability, email alerts,
load prioritization, and power consumption. Results evaluated against engineering requirements.
06
Refinement, Calibration & Circuit Protection
Performed troubleshooting, sensor calibration (DCT voltage sensors), and firmware optimization. Added
resettable fuse protection per outlet and implemented the IP65 waterproof enclosure. Addressed timezone
consistency challenges in Grafana scheduling and data flow issues between Boron and the dashboard.
Challenges & Risks
Key Challenges & Mitigations
Solar Power Availability
The largest challenge was the possibility of days with zero or negligible solar charging. Worst-case
scenarios were simulated and tested to evaluate system lifetime. The load management and priority system
was developed to mitigate this — by selectively powering devices based on priority, the system extends
operational lifetime until the next period of solar availability. Load prioritization triggers at 11.8V
with a secondary threshold at 11.5V.
LTE Connectivity in Remote Areas
There is a risk of deployment in areas with poor LTE coverage. The team evaluated different antenna types
to maximize range. The system is also designed to retain and continue the last known operating mode when
connectivity is lost, preventing total failure until connection is restored.
Timezone Consistency
A significant challenge during dashboard development was keeping timezones consistent across all platforms
(Grafana, database, Boron, ESP). Everything was kept in UTC, though this required careful handling to avoid
scheduling errors from timezone confusion. Keeping UTC as the single standard resolved most issues.
Data Format Between Boron and Dashboard
Getting the data flow from Boron to the Grafana dashboard working correctly required resolving format
mismatches. The Boron was found to parse CSV format more reliably than JSON, so the PHP files were modified
accordingly. Once the format was standardized, data flow became consistent.
Visuals
Photos
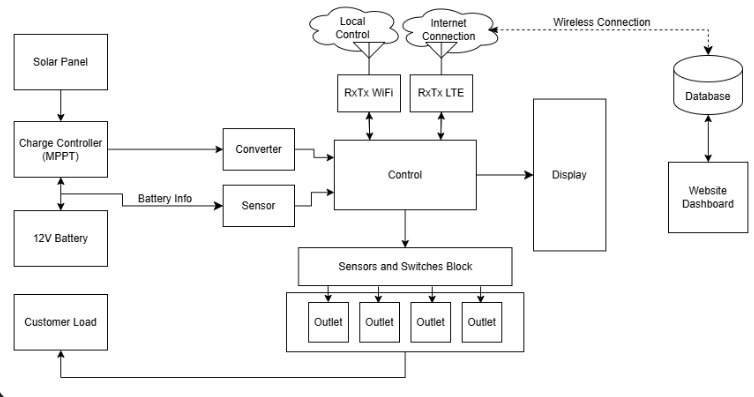
Block Diagram of R.E.A.C.H.
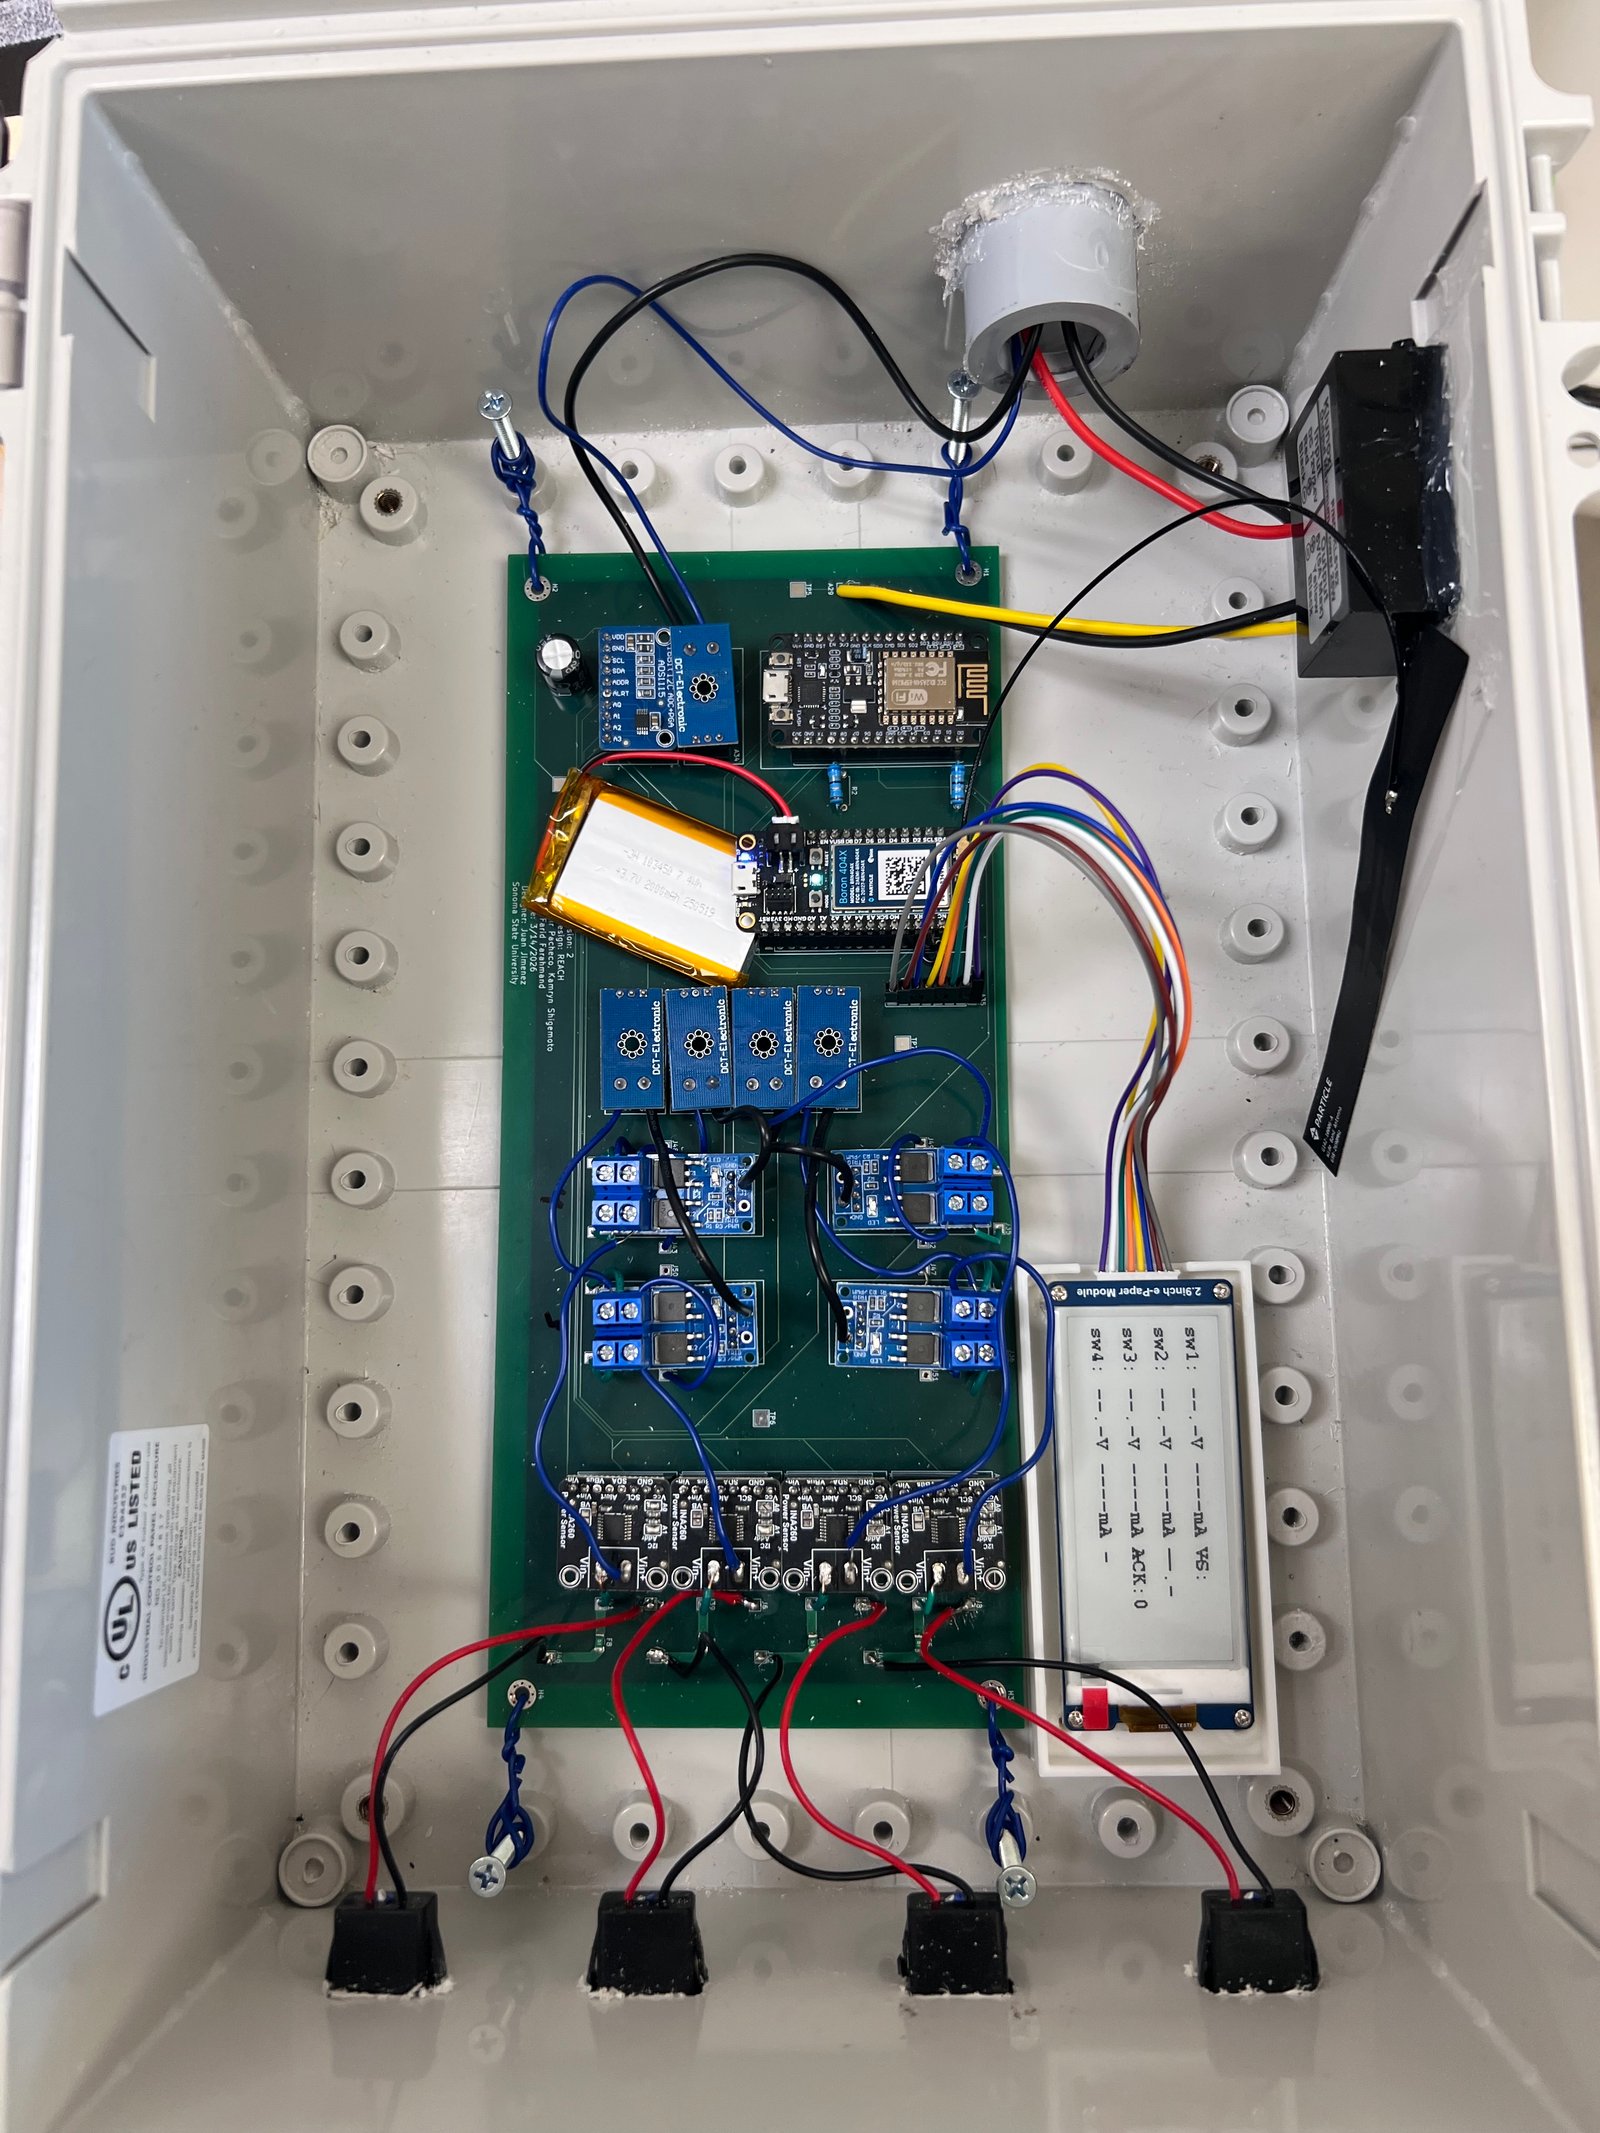
Completed R.E.A.C.H. System
References
Literature & References
-
[1]
OutBack Power, "OpticsRE: Monitoring and System Control."
outbackpower.com
-
[2]
Victron Energy, "Victron GX product range."
victronenergy.com
-
[3]
Victron Energy, "VRM Portal – Dashboard."
victronenergy.com
-
[4]
Morningstar Corporation, "Solar Charge Controllers & Inverters."
morningstarcorp.com
-
[5]
K. Pitchaimuthu and B. Sridhar, "An IoT Based Smart Solar Photovoltaic Remote Monitoring and Control Unit."
researchgate.net
-
[6]
A. Hamied et al., "IoT-Based Low-Cost Photovoltaic Monitoring for a Greenhouse Farm," Energies, 2023.
mdpi.com
-
[7]
"IoT Based Solar System Monitoring and Load Management for Small Farm," 2022.
researchgate.net
-
[8]
A. Burgio et al., "An IoT-Based Solution for Monitoring and Controlling Battery Storage Systems," Energies, 2023.
mdpi.com
-
[9]
Particle, "Particle Boron: 2G/3G or LTE Cat M1 + Bluetooth."
docs.particle.io