Fall 2025 — Table 5
Fall 2025 Summary of Tests
| Test # | Objective | Related ER | Status | Notes |
|---|---|---|---|---|
| FT.1 | Two-way communication between ESP and Particle Boron | ER1, ER2, ER3 | Complete | Continue to test more advancements |
| FT.2 | Website control through WiFi connection | ER11 | Complete | Successfully changed status of output over WiFi |
| FT.3 | Current and voltage readings from INA219 | ER7 | Complete | Looking to optimize IC accuracy or find another |
| FT.4 | Range of communication using ESP network | ER11 | Incomplete | Looking into antennas to extend range |
| ST.1 | Calculate power consumption of the system | ER6 | Complete | Power calculations completed |
Spring 2026 — Table 6
Spring 2026 Summary of Tests
| Test # | Objective | Related ER | Status | Notes |
|---|---|---|---|---|
| FT.5 | Scheduling for all 4 outlets, single instances in one day | ER2, ER12 | Complete | All 4 outlets scheduled successfully multiple times |
| FT.6 | ESP link reliability over extended operation | ER3, ER7 | Complete | Telemetry received accurately; only 1 point dropped in 13 hours |
| FT.7 | Email alert for load prioritization | ER2 | Complete | Email alerts sent correctly on voltage threshold |
| ST.2 | Power consumption of built system under normal operation | ER4, ER5, ER6 | Complete | Successfully operated well below the engineering requirement |
| FT.8 | Current readings from the INA260 | ER7 | Complete | Successfully measured the current accurately and precisely |
| FT.9 | Voltage readings from the DCT-Electronic voltage sensors | ER7 | Complete | Successfully measured the voltage precisely and accurately |
| FT.10 | Load Prioritization Test | ER2 | Complete | Successfully shut off low priority lines while leaving high intact |
| FT.11 | Power consumption under normal operating conditions | ER6 | Complete | System uses less than 5W under normal conditions |
Test Documentation
Fall 2025 — Detailed Tests
FT-12-Way Communication TestComplete
Objective
Test basic two-way communication between the ESP8266 and Particle Boron 404x via UART.
Related ER
ER-1, ER-2, ER-3
Setup
Connect the two microcontrollers together serially via UART. Connect to power and ground with an LED load. Monitor serial terminals via laptop USB.
Procedure
Run code to exchange messages between both microcontrollers. Test commands to turn LED on/off from each microcontroller.
Pass / Fail Criteria
Pass if communication is established and LED can be controlled via ESP website or Boron commands. Fail if messages cannot be sent/received or LED cannot be controlled.
Notes
Continuing to test more advanced communication features.
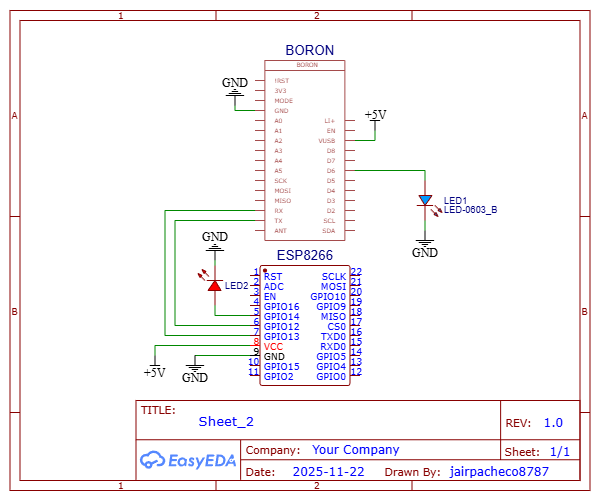
Fig. 7 — Test setup diagram for the 2-Way Communication Test
Conclusion
We were able to successfully achieve 2-way communication between the Boron and ESP8266 — the LED was controlled to turn on and off via both microcontrollers.
FT-2WiFi Control TestComplete
Objective
Test website control of outlet status through the ESP8266 WiFi network.
Related ER
ER-11
Setup
Connect ESP8266 to power, ground, and a laptop for serial monitoring. Use a smartphone to connect to the ESP's WiFi network and access the locally hosted webpage.
Procedure
Run code on ESP8266. Connect smartphone to ESP WiFi and navigate to local URL. Toggle USB outlet on/off. Verify refresh button shows correct status.
Pass / Fail Criteria
Pass if outlet status changes via webpage and refresh reflects accurate state. Fail if device cannot connect or status is not reflected correctly.
Notes
Successfully changed status of output over WiFi.
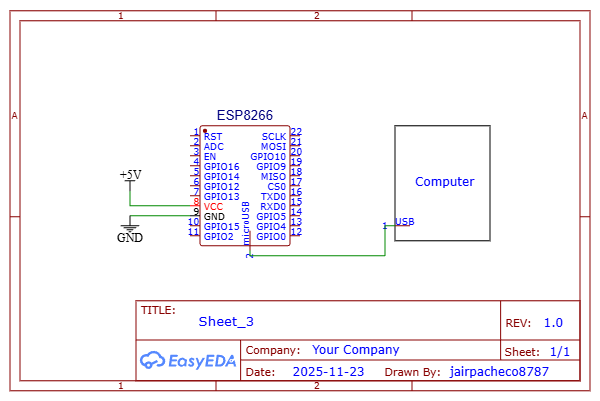
Fig. 8 — Test setup diagram for the WiFi Control Test
Conclusion
The website was successfully used to wirelessly control the outlets and refreshed to show the most updated status.
FT-3INA219 Sensor TestComplete
Objective
Test current and voltage readings from INA219. (Note: replaced by INA260 in final design.)
Related ER
ER-7
Setup
Connect INA219 sensor to ESP8266 via I²C. LED connected as the test load.
Procedure
Take voltage and current measurements using the sensor and compare with actual values. Evaluate accuracy as a fit for the project.
Pass / Fail Criteria
Pass if measurements are within accuracy range of ER-7. Fail if accuracy does not meet requirements.
Notes
Sensor was not within the required accuracy range. Team subsequently upgraded to INA260.
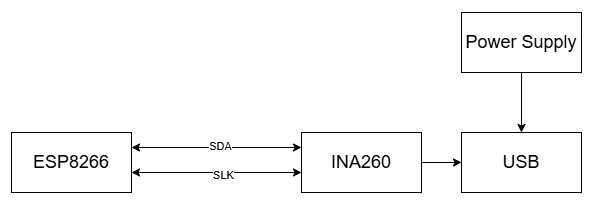
Fig. 9 — Test setup diagram for the INA219 Current and Voltage Sensor Test
Conclusion
The current sensor wasn't within the required accuracy range, so a second round of testing was conducted with the INA260 to satisfy accuracy requirements.
FT-4ESP Network Range TestIncomplete
Objective
Test maximum WiFi range of the ESP8266 hotspot.
Related ER
ER-11
Setup
ESP8266 powered outdoors via portable supply. Smartphone connected to ESP WiFi network. Distances measured outdoors.
Pass / Fail Criteria
Pass if connection is maintained at ≥ 20m distance. Fail otherwise.
Notes
This test was not completed due to time constraints — most time was dedicated to getting core components working.
Conclusion
This was a fail due to time constraints. It was considered a lower-priority test compared to other project demands.
ST-1System Power Consumption (Fall)Complete
Objective
Calculate power consumption of the system using component-level measurements.
Related ER
ER-6
Setup
Full system assembled. Power measurements taken per component using sensors.
Pass / Fail Criteria
Pass if internal system consumes ≤ 5W under typical operation.
Notes
Power calculations completed. Full instrumented test conducted in Spring (ST-2 / FT-11).
Conclusion
After testing, we found that the system consumed less than 5W during typical operation.
Test Documentation
Spring 2026 — Detailed Tests
FT-5Schedule Reliability Over Time TestComplete
Objective
Test scheduling feature for all four outlets across single instances throughout one day.
Related ER
ER-2, ER-12
Setup
Full REACH circuit with loads on all 4 outlets (3 ESP8266 boards + 1 LED). Scheduled 15-minute ON/OFF intervals via Grafana dashboard, repeated 3 times per outlet in one day.
Procedure
Set single-instance schedules in Grafana. Connect loads to each USB outlet to measure current draw. Record current values at each interval and verify outlets switch at scheduled times.
Pass / Fail Criteria
Pass if all 4 outlets turn on/off at correct scheduled times and maintain target state for full 15-minute duration. Fail if any outlet misses its scheduled transition.
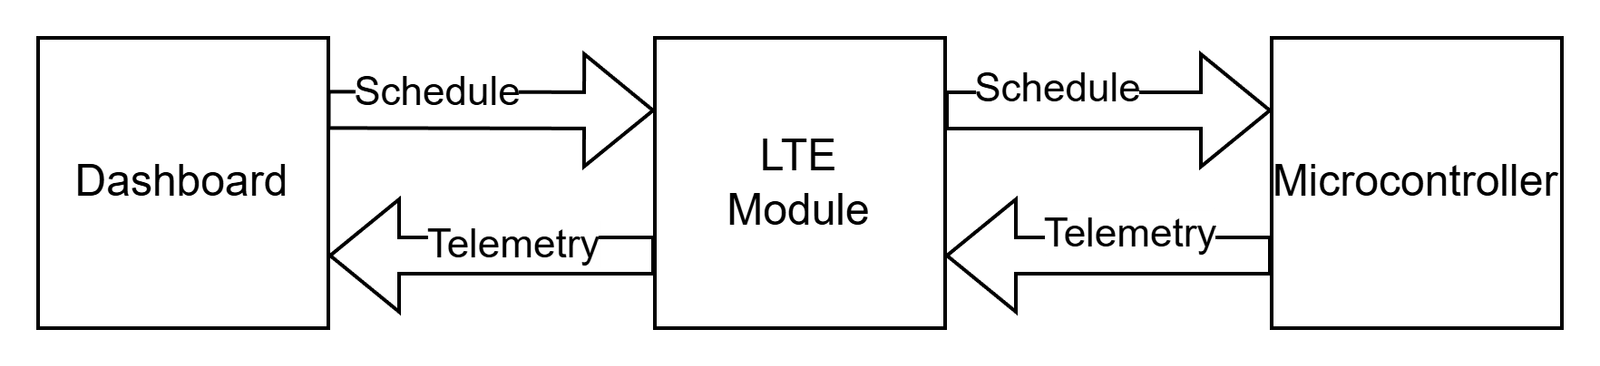
Fig. 10 — Test setup diagram for the Schedule Reliability Over Time Test
Conclusion
All four outlets were successfully turned on and off 3 times each in one day. All scheduled segments started at the correct time. Only one data point was lost in transmission.
FT-6Link Reliability TestComplete
Objective
Test how accurately and consistently the ESP sends telemetry data to the database over an extended period.
Related ER
ER-3, ER-7
Setup
REACH system operated continuously for ~13 hours on March 7, 2026. Expected 57 telemetry uploads (10-minute intervals).
Procedure
Analyzed database for all 57 expected telemetry events. Verified all 4 outlet values per event for accuracy and completeness.
Pass / Fail Criteria
Pass if most telemetry data received for all 4 outlets with no bogus values. Fail if a significant number of data points are missing or contain unexplainable values.
Conclusion
Out of 57 expected uploads, only one data point was dropped for outlet 4. Link reliability confirmed — timing was accurate throughout the 13-hour period.
FT-7Load Prioritization Email Alert TestComplete
Objective
Verify that Grafana sends an email alert when battery voltage drops below 11.8V.
Related ER
ER-2
Setup
Grafana alert configured to check battery supply voltage every minute. Alert fires below 11.8V. Checked email alert functionality three times over two hours.
Pass / Fail Criteria
Pass if email received when voltage below 11.8V. Fail if alert fails to fire or fires incorrectly.
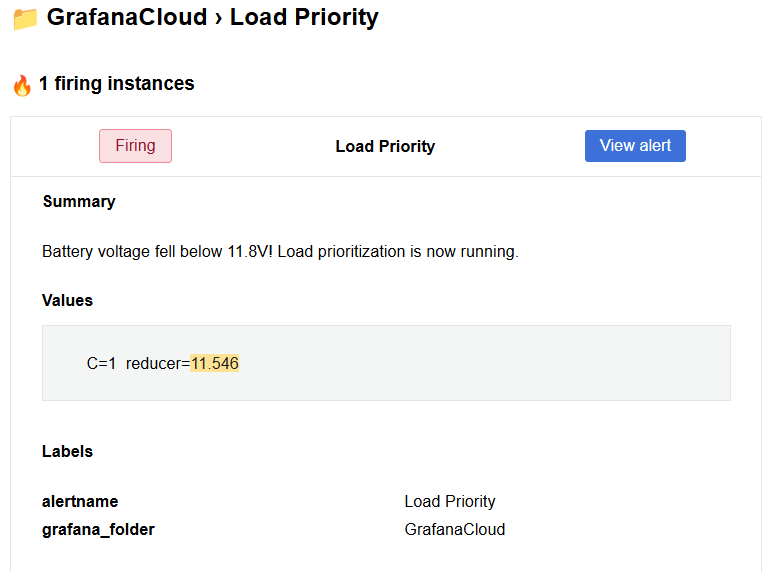
Fig. 12 — Test setup diagram for the Load Prioritization Email Alert Test
Conclusion
Email alerts sent successfully when battery voltage fell below 11.8V across three verification checks over two hours.
FT-8INA260 Current Sensor Accuracy TestComplete
Objective
Verify INA260 current sensor accuracy for outlet power measurement.
Related ER
ER-7
Setup
INA260 with arbitrary load on a power station. Load current increased from 0 to 1A in steps.
Pass / Fail Criteria
Pass if measured current is within ±10 mA of actual load current. Fail if error exceeds 10 mA.
Fig. 13 — Test setup diagram for the Current Sensor Accuracy Test
Conclusion
Sensors passed with an accuracy of ±10 mA.
FT-9Voltage Sensor Accuracy TestComplete
Objective
Verify DCT-Electronic voltage sensor accuracy after calibration.
Related ER
ER-7
Setup
Full REACH circuit. Bench power supply stepped from 0V to 15V in 0.5V increments. Readings taken through ADS1115 to ESP.
Pass / Fail Criteria
Pass if voltage measured within ±0.2V after calibration. Fail if error exceeds ±0.2V.
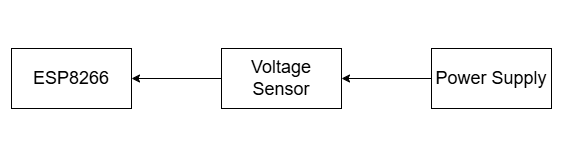
Fig. 14 — Test setup diagram for the Voltage Sensor Accuracy Test
Conclusion
Sensors passed within ±0.2V accuracy after calibration.
FT-10Load Prioritization TestComplete
Objective
Test load prioritization algorithm with variable loads and simulated voltage drops.
Related ER
ER-2
Setup
Full REACH circuit with LEDs + potentiometers as variable loads. DC bench supply simulates battery voltage drop below thresholds (11.7V and 11.5V). Outlet #1 set as high priority; all others low.
Procedure
Case 1: High-priority outlet draws high current; low-priority outlets draw minimal. Drop voltage below 11.7V — high-priority stays on, highest-draw low-priority shuts off. Case 2: Two low-priority outlets draw equal current (within 5 mA). Both shut off when voltage drops.
Pass / Fail Criteria
Pass if high-priority outlet never turns off and only the highest-draw low-priority outlet shuts off per case. Fail if prioritization logic does not match expected behavior.
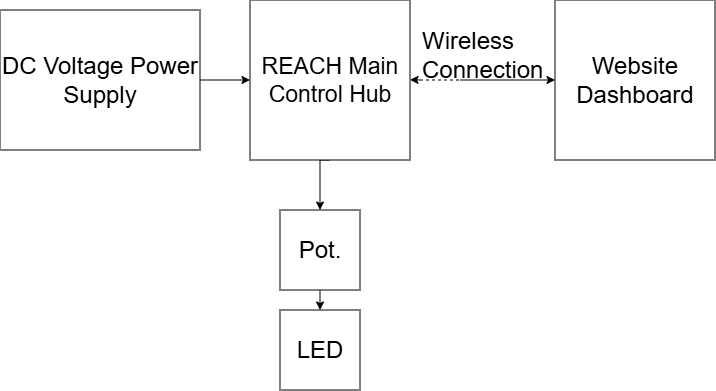
Fig. 15 — Test setup diagram for the Load Prioritization Test
Conclusion
Prioritization algorithm passed — all conditions met across both test cases.
FT-11Power Consumption Test (Instrumented)Complete
Objective
Verify internal system power consumption does not exceed 5W under normal operating conditions.
Related ER
ER-6
Setup
NORDIC Power Profiler Kit II used to power and log power consumption. REACH box operating under normal conditions without MOSFET switches activated.
Procedure
Power Profiler Kit II (10% accuracy) connected to REACH. System powered and operated normally. Power consumption logged and averaged via the Power Profiler UI.
Pass / Fail Criteria
Pass if logged power consumption is ≤ 5W under normal conditions without attached loads.
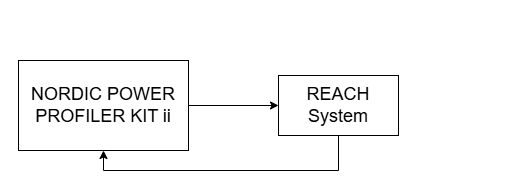
Fig. 16 — Test setup diagram for the Power Consumption Test
Conclusion
The system uses less than 5W of power under normal operating conditions.